 APPS
APPS
 APPS
APPS
 APPS
APPS
Salesforce Inc.’s data visualization platform Tableau Software today introduced a major update that includes further extensions to its visualization capabilities and also promises to help organizations administer, create and scale analytics in the cloud.
The new updates, announced today with the Tableau 2024.3 release, include the key feature Tableau Cloud Manager which the company said will allow organizations to create and manage multiple Tableau sites across multiple global regions. It will also permit administrators to centrally manage licenses and users across sites without having to license any single user multiple times.
The new Cloud Manager feature is designed to simplify the cloud analytics environment for users while permitting them to choose their data residency and governance requirements. This permits them to scale at their own pace, without the need for additional costly licenses. The company said the new feature would roll out in waves to existing companies.
Administrators can now enable up to 20 identity providers on a single cloud site and multiple identity providers can be used to provide external, internal and partners access to the Tableau cloud. This new feature will allow admins to consolidate access for internal and external users across global organizations. In combination with cloud management, that will permit broader scaling.
Visualization for analysts comes to Tableau with a Tables Viz Extension that allows them to add detail tables and grid views to dashboards for users who prefer more traditional reporting. Salesforce said this new visualization type can be configured for new columns in tables by dragging fields in cards that can be customized for reports. The new extension is now available in the Tableau Exchange.
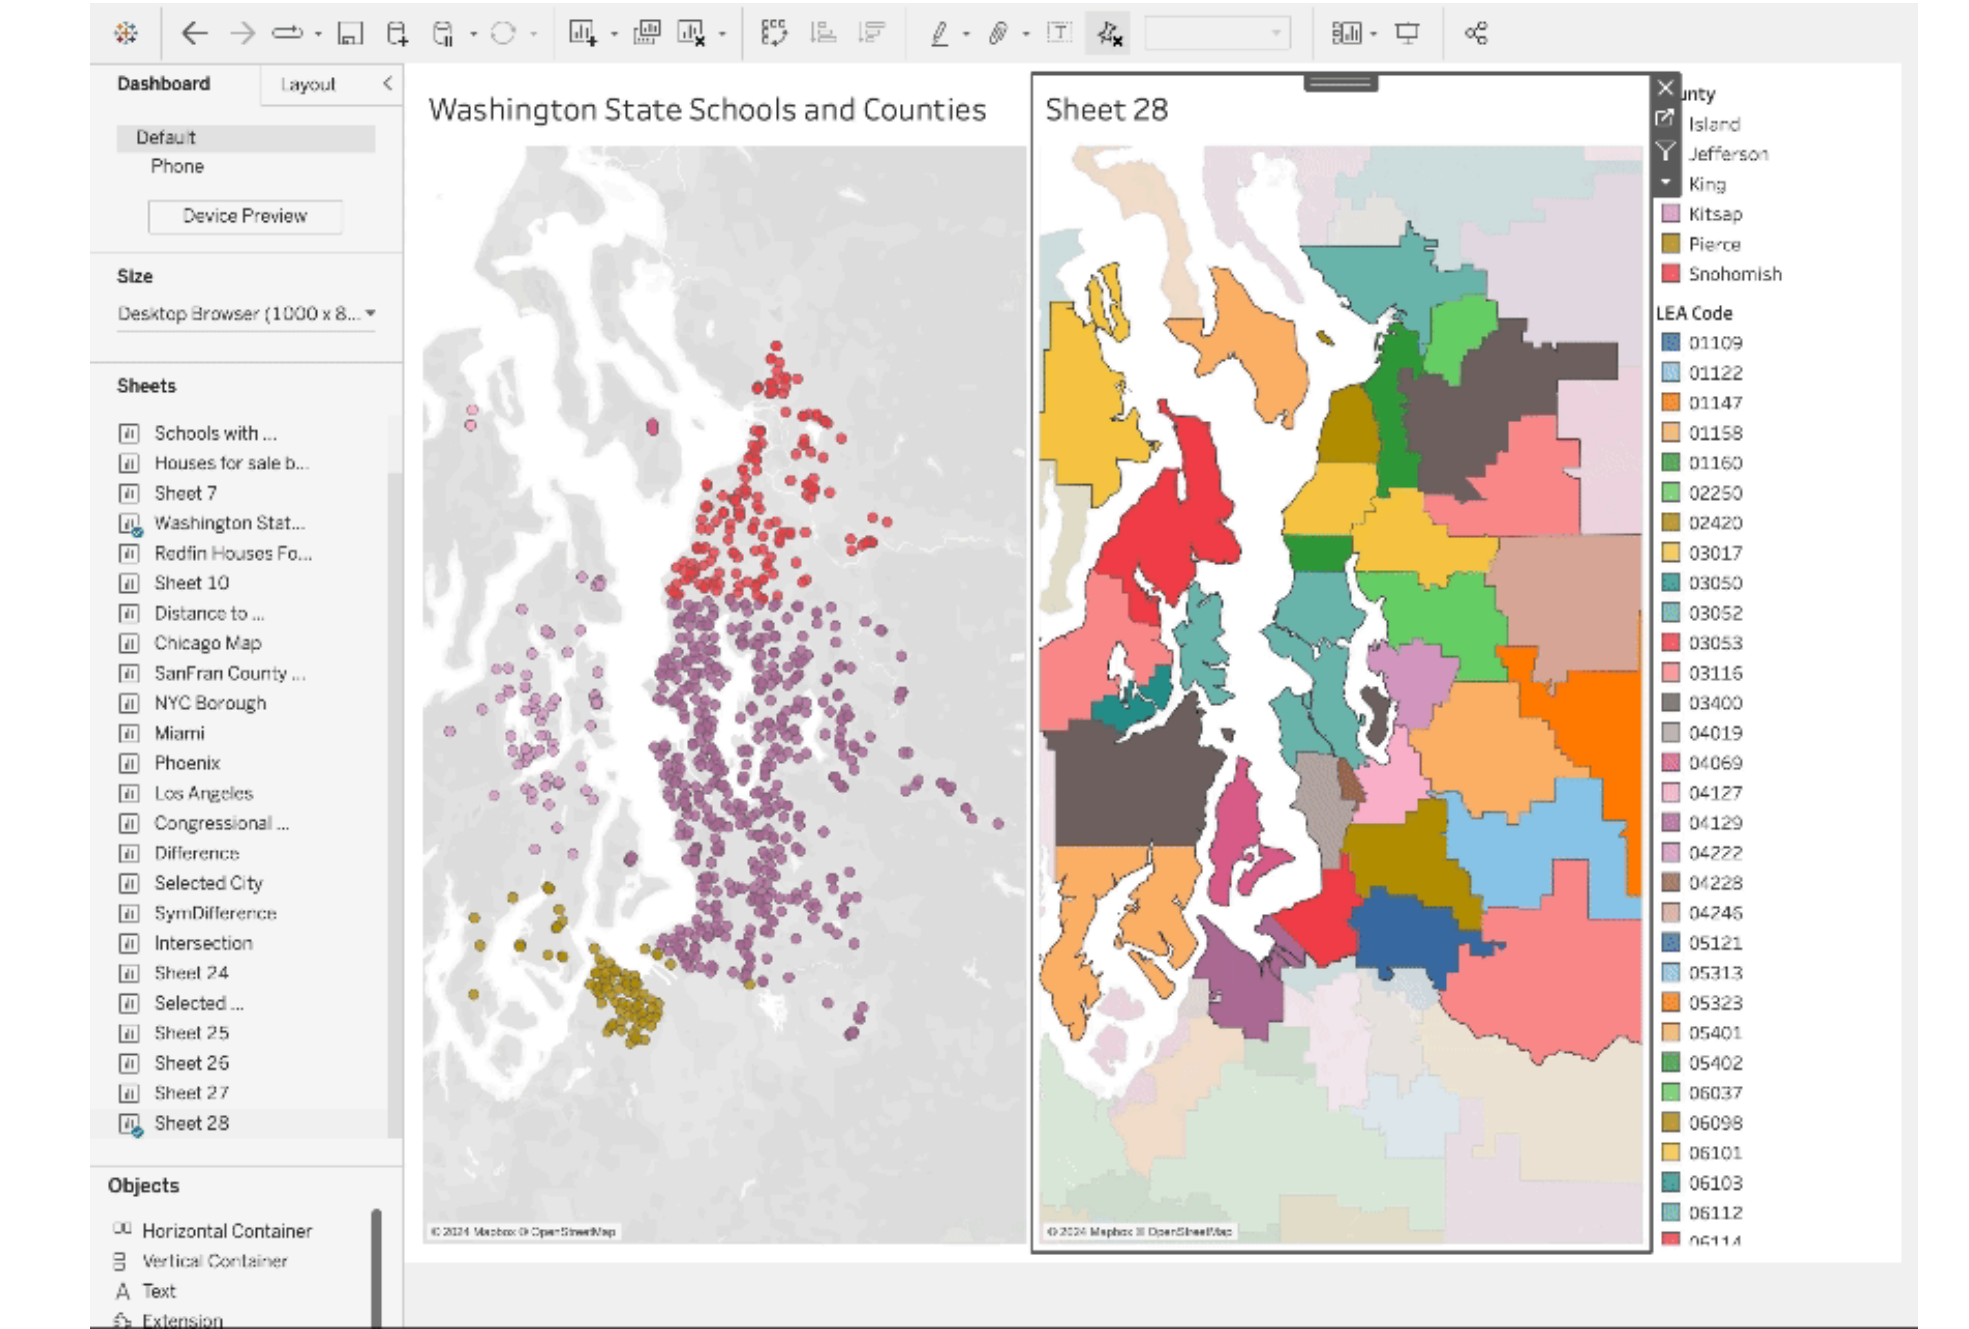
The new update also adds geospatial data including what the company says is support for spatial parameters. Spatial parameters provide rich, interactive dashboards that can deliver visualizations of spatial information about geographies such as countries, states, regions, cities, forests, spaces or anything that can be measured. The “Spatial” parameter type can represent numerous geometries including points, lines and polygons representing locations, paths and regions.
This allows for numerous different graphical displays and calculations including the displays of region maps, behavior based on selection, highlights based on location and more.
Microsoft Teams users can now interact with Tableau data through app integration. This brings Tableau dashboards and Pulse metrics directly into Teams workflows directly into personal apps, messages, channels and meetings, without users ever having to leave. Using the app connectivity users can analyze and share insights in messages and explore their data. Tableau added that pinned channel content is also available for Teams meetings for interactive visualization.
THANK YOU